Here's how to view the demographics of voters in your hometown

Curious about the voting demographics in your province, city, or municipality?
You can now have a quick overview of the voters' profiles in your hometown through GMA News' Eleksyon 2022 website.
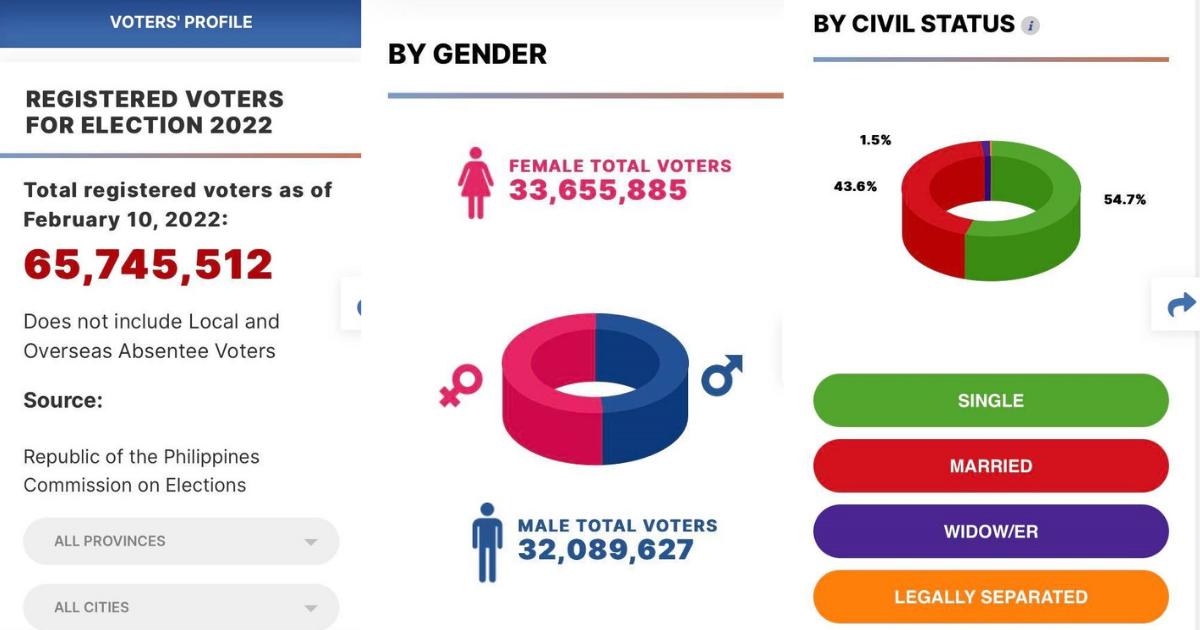
Voters are categorized by gender, age group, and their civil status. These data provided by the Commission on Elections are presented in graphs for easier reference.
Here's a step-by-step guide on how to navigate through the website:
1. Choose a location from the dropdown menu on the left. You may view information for all provinces or just from a specific one. There's also an option to pick a city.
Note that the data for gender, age group, and civil status will adjust accordingly on these options.
2. Head to gender where you will see data for the total of male and female voters. Scroll your cursor on the pink portion of the chart to see the percentage and number for women then on the blue portion for men.
3. For the next portion, choose an age group out of 10 or select multiple groups at once to be shown on the chart, which will also display the percentage of the chosen group from the total voters.
4. Slide your cursor through the table of people located just above the donut chart for the exact number. Grey people turn blue when they're among the chosen age group.
5. In the civil status section, you may choose to view all the options at once or one by one. It is divided into four: single (green), married (red), widow/er (purple), and legally separated (orange).
You'll know that you're viewing a specific civil status when it's in color. The donut chart will adjust based on your preferences and will show the percentage of your choices.
Before you cast your vote on May 9, do an ample amount of research before making a choice. You may turn to the Eleksyon 2022 Candidates page and Guides page for more information.
You can also generate your own printed kodigo to ensure that you will shade the right circles on the ballot.
—Franchesca Viernes/MGP, GMA News


