
Is your area prone to flooding? Check UP NOAH's hazard data map
The UP Resilience Institute has shared Project Noah's hazard database map which aims to inform the public about the hazards—including floods, landslides, and storm surges—in their real-time locations.
The application may be accessed here: https://noah.up.edu.ph/know-your-hazards.
The hazards in the map database include:
- 100-year rain return for floods;
- Shallow and structurally-controlled landslides; and
- 5-meters for storm surges.
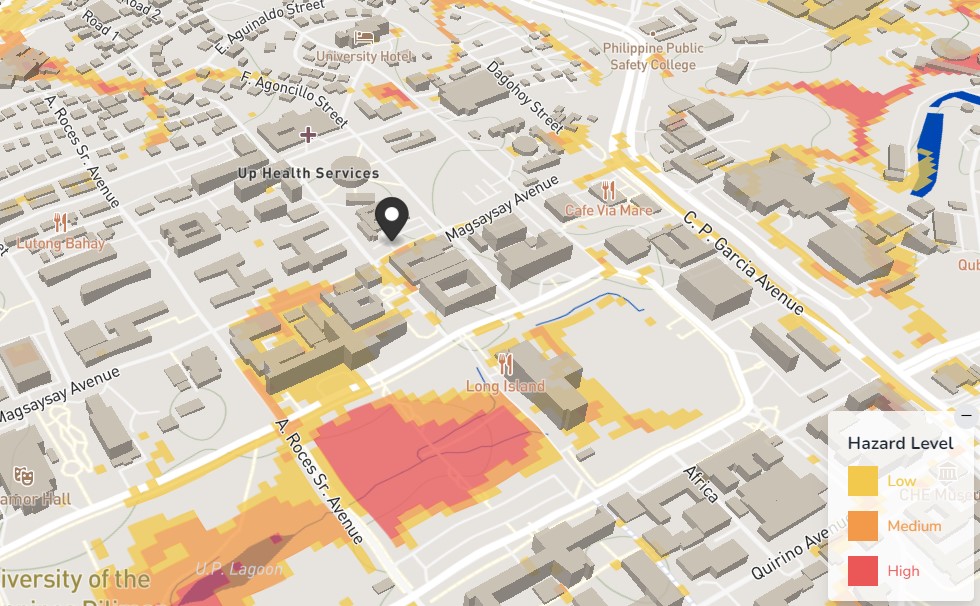
The public can simply type in their location in the search bar, and it will show a map with corresponding colors to show hazard levels: yellow (low), orange (medium), and red (high).
According to the website, the hazard levels are based on flood simulations as well as satellite and historical data.
Meanwhile, the institute called on the public to take photos of flooded streets to validate flood models for disaster risk reduction efforts in the future.
Several parts of the country, including Metro Manila, experienced massive flooding on Wednesday due to the Southwest Monsoon and tropical cyclone Carina, which is now a super typhoon as it moves toward Taiwan. —NB/VBL, GMA Integrated News
